The head-and-shoulders pattern is one of the most popular chart patterns in technical analysis. It’s popularity is mainly attributed to the fact that it easy easier to spot than other patterns. It’s name comes from what the pattern looks like: A head and two shoulders (and a neckline).
The pattern indicates a reversal is likely to happen after the pattern has been completed. The head and shoulders pattern comes in two forms, top and bottom. The bottom head and shoulders pattern is very similar to the double bottom pattern or triple bottom pattern and are similar in many ways.
If we look at a graphical representation of the Top Head and Shoulder Pattern we can see that the pattern is composed of two shoulders, a head, and a neckline:
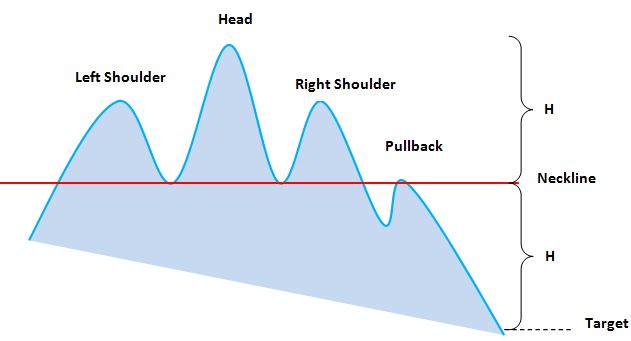
The pattern does not need to look exactly like this, but it does need to follow a couple guidelines:
- The pattern must start with an upward trend and have a head that is higher than the two shoulders.
- The shoulder heights should also be roughly the same height, though the troughs can be different heights (ascending troughs are more desirable, that is to say the second trough is higher than the first trough).
In this graph, H stands for height and, in general, we can set our target price (to exit the position) roughly the same height between the difference of the neckline and the top of the head. The downward trend is likely to hit the target price of the same difference H between the neckline and the target. This is a good place to put a stop loss order.
Another thing to note is that the pullback is not necessarily always part of the pattern, it only happens about half the time. It does not have to go over the neckline, (it is even preferable that it does not) and should not be there long, or pass the neckline by a large amount. Top patterns are fairly reliable and take a downward exit (past the neckline) in approximately 90% of cases.
Here is also an example of a Bottom Head and shoulder without pullback.
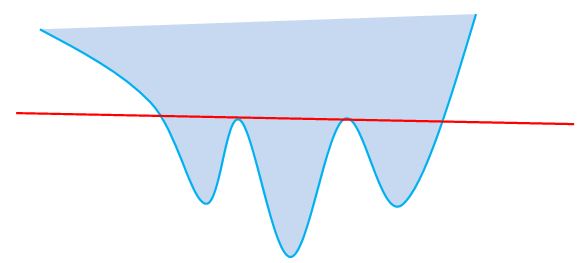
This chart is almost identical to the Top and head shoulder and follows the same rules but inverted.
Volume:
The underlying volume is a key indicator in successfully trading this pattern. Without volume the pattern is considered weak at best and is far more risky to trade.
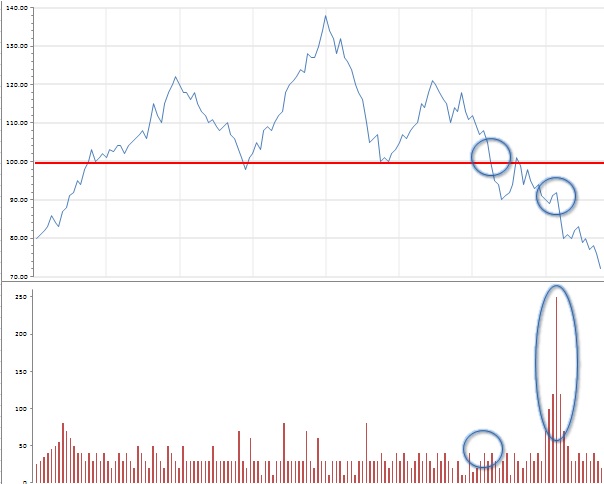
Above, we can see that when the stock first crosses the line at the first bubble many would be tempted to trade the stock as it is fulfilling the pattern. That may have been very risky as it could simply have been a momentary decline without much strength. The far safer and more important time to trade is when the stock continues with it’s support and trades down with significant volume. This is a far stronger indication of trend.
To summarize, head and shoulders are one of the first patterns students learn in technical analysis. It is important to not only look at the pattern but to have a strong volume when breaking through the neckline or various supports and resistances.
 Invest2Success.com