There’s been a lot going on in the technology sector lately, with the NVIDIA Corporation (NASDAQ: NVDA) sell off and the selloff in late June after Alphabet Inc Class A (NASDAQ: GOOGL) got hit with a $2.7B fine, which pushed the stock down over 2% after the announcement. Volatility in NASDAQ-100 Now, in early June, Read More…
Crude oil prices have been climbing up steadily in the last couple of months as investors continue to expect a balance in the demand and supply dynamics of oil. Last year, OPEC announced that it has worked out a deal with its member nations and some other producers to cut production volumes in order to Read More…
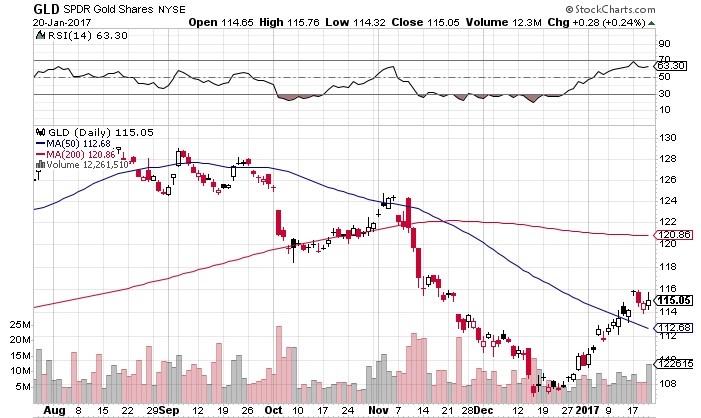
Gold is currently trading at $1,215.85 per ounce, up 0.96% or $11.55. The precious metal has gained 6.40% over the past 30-day period, up $72.40. For the year to date, gold is up 4.7%, and it has an average return of 10.7% since 2002. Its best year on record in that time is 2007 when Read More…
When it comes to currency trading, there is a vast range of different strategies you can adopt to generate trading profits. For example, you could pursue an event-focused strategy, where you place trades just after large market-moving macroeconomic or political events. Alternatively, you could put on medium to long-term trades based on your view of Read More…
Fibonacci Arc is a technical analysis indicator and is utilized to give hidden support and resistance levels for security. It is built by drawing a trend line between two swing points on a chart.
Double Bottoms are reversal patterns and often seem to be one of the most common (together with double top patterns) patterns for currency trading. Double Bottoms patterns are identified by two consecutive low prices of the same depth with a moderate pull back up in between (neckline peak).
The head-and-shoulders pattern is one of the most popular chart patterns in technical analysis. The pattern looks like a head (the middle peak) with two shoulders (two equal heiight peaks).
A cup-and-handle chart pattern resembles a cup of tea. These are bullish continuation patterns where the growth has paused. momentarily, it trades down and then continues its upward pattern. This pattern must always be at least 5 weeks long and can last up to a year.
You do not need anything else on a stock chart but the candles themselves to be a successful swing trader! And, there is nothing that can improve your trading more than learning the art of reading candlestick charts
A good earnings surprise is a pattern in which a company circulates an earnings announcement. Then the market will interpret it as better than was expected.
An event pattern called a bad earnings surprise is where a company distributes an earnings announcement then the market defines it as worse than expected. Even in a bear market about 61% will have upward breakouts.
An inverted dead-cat bounce is quite the opposite of the dead-cat bounce. A quick look is if a trader owns a stock following a quick and large (5-20%) gain there is normally a gap up. If you sell on the next day after the gap up day, thus unlocking profits its because prices normally start falling before beginning a new move upward (Bulkowski, 2005).
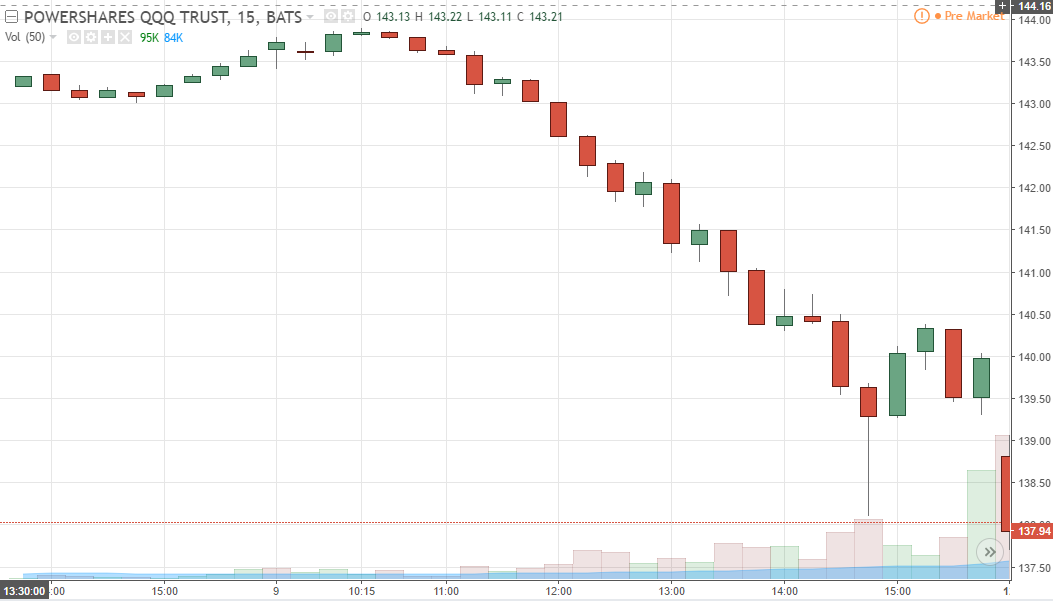
A trading term called a dead cat bounce is used to when a stock is in a severe decline and has a sharp bounce off the lows. It occurs due to the huge amount of short interest in the market. Once the supply and demand has become unbalanced, any type of bear market rally will create a massive short covering which will lead to a swift price move up. This bounce will be short lived and followed up by heavy selling which will break the prior price low.
A gap in a chart is basically an empty space between one trading period and the one prior to that trading period. They normally form on account of an important and material event that will affect security, like an earnings surprise or a merger agreement.
Flags and Pennants are categorized as a continuous pattern. They normally represent only brief pauses in a dynamic stock. They’re typically seen immediately after a quick move. The stock will then take off again in the same direction. Research shows that these patterns are many of the most reliable continuation patterns. Take a look at typical Flags and Pennant pattern.
The V top is a reverse V-shaped top thus the name. The top is quite sharp. It’s due to the irrationality of actors leading to a steep increase that will be corrected shortly afterwards. The V top will occur most often in an upward trend and will often signal a trend reversal. It can also appear in a downward trend, like when in an economic announcement.
The V bottom is shaped like a V thus the name. The dip will be quite sharp. It’s because the irrationality of actors leading to a steep fall which will be corrected shortly after. The V bottom will occur most often in a downward trend and will generally offer a signal trend reversal. It can also appear in an upward trend (like in an economic announcement).
A horizontal channel is a pattern that underlines investor’s indecisiveness. This horizontal channel is assembled by two horizontal and parallel lines that build the progress of the price. To confirm a line, there should be at least two points of contact with the price. The more contact points it will has, the more these will be durable and their breakout will give an substantial buy/sell signal.