Final Rank: 318 / 518 Final Portfolio Value: $992,114,784.48 (-0.79%) Investment Strategy For The Blue Chip Investment Contest Since time was very limited for me in the Blue Chip Investment Challenge. I just tried to get as much profit as possible by trading SPXU and other triple leveraged ETF’s and trying to time the market. Read More…
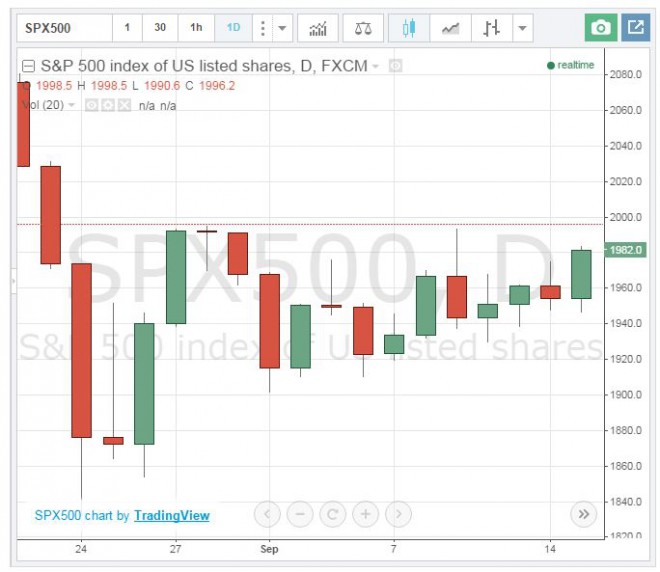
Using the trading view Advanced Chart software will certainly give you an edge. Don’t forget to trade after doing your analysis! [chart] Using the Trading View Advanced Chart The chart is extremely intuitive but here is a quick tutorial on using it. (if you do not see the left hand panel click on the little Read More…
Fibonacci Arc is a technical analysis indicator and is utilized to give hidden support and resistance levels for security. It is built by drawing a trend line between two swing points on a chart.
Definition A Stop (or stop loss) order and limit order are orders that try to execute (meaning become a market order) when a certain price threshold is reached. Limit and stop orders are mirrors of each other; they have the same mechanics, but have opposite triggers. When creating a limit or stop order, you will select Read More…
Definition An order type that allows to set a moving stop or limit target price. The target price moves based on the daily high. Trailing stops can be set either in percentage or in dollars and cents terms. When in dollar terms it will activate when the price has moved by the target you have Read More…
Promissory notes issued by a corporation or government to its lenders, usually with a specified amount of interest for a specified length of time. This is seen as a loan from the bond holder to the corporation. The value of Bonds traded are greater than the value of stocks traded.
Definition Your “Risk Level” is how much risk you are willing to accept to get a certain level of reward; riskier stocks are both the ones that can lose the most or gain the most over time. Risk Understanding the level of risk you need and want is a very important part of selecting a Read More…
Definition: An asset is anything that has monetary value and can be sold. Assets can be anything from a pencil (though it is not worth much) to a skyscraper to things like Stocks and ETFs. There can also be intangible assets such as the value of a brand name or logo. Details: Assets generally refer Read More…
Definition “Asset Allocation” is how you have divided up your investments across different assets. You can have all your assets in one place, or you can use diversification to spread them around to reduce risk. Details Whenever you pick stocks, open a bank account, get paid, buy something, or do anything with any resources, you Read More…
An investment strategy is the set of rules and behaviors that you can adopt to reach your financial and investing goals. Choosing an investing strategy can be a daunting task when you are starting to learn about investments and finance. Here we will look at the larger overall strategies rather than very specific strategies. Given Read More…
In finance, Volume-Weighted Average Price (VWAP) is a ratio of the profit traded to complete volume traded over a distinct time horizon – normally one day. It’s a portion of the average price a stock traded at over the trading horizon.
Definition Open Interest is the total number of options or futures contracts that are “open”, meaning currently owned by an investor and not yet expired. Details Think first in terms of options contracts: by owning an option, it signifies that there is interest in actually trading that stock, although at a different price. Since this Read More…
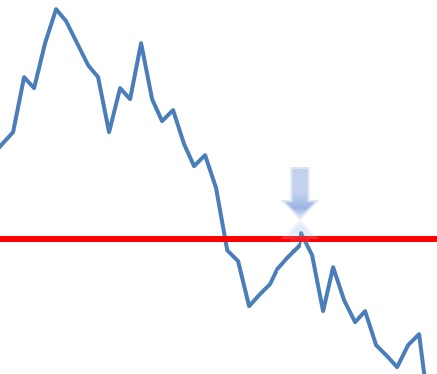
A pullback is a technical analysis term used frequently when a stock “pulls” back to a resistance and/or support line, usually after a breakout has occurred. Pullbacks can be in an uptrend or downtrend and can pull back upwards or downwards. In the example below we can see a pullback as it retraces back to Read More…
The head-and-shoulders pattern is one of the most popular chart patterns in technical analysis. The pattern looks like a head (the middle peak) with two shoulders (two equal heiight peaks).
A cup-and-handle chart pattern resembles a cup of tea. These are bullish continuation patterns where the growth has paused. momentarily, it trades down and then continues its upward pattern. This pattern must always be at least 5 weeks long and can last up to a year.
There are a couple of different strategies that you can employ to build a stock portfolio: 1) You can take the risk that the products will not be good, and buy the cheapest brands of everything on the list; 2) You can buy half the things on the list from the discount aisle, while splurging on good brand names for the other half; or 3) You can avoid the risk of disappointment and buy just big brand names.
HTMW QuoteIt can be argued that the decision to follow a strategy – any strategy – is more important than the decision about what specific strategy to pick. Even a mediocre strategy… can be more profitable than the investing done by someone without a strategy at all . . . John Reese
If you perform four or more day trades in a 5 day period you may get flagged by the SEC as a “Pattern Day Trader.” This can cause you to lose your margin account status until you deposit enough cash to have $25,000 or more in your account. Many beginning traders have been bitten by this rule!
The data provided in Figure 2 provides the following information:
Column 1 – OpSym: this field designates the underlying stock symbol (IBM), the contract month and year (MAR10 means March of 2010), the strike price (110, 115, 120, etc.) and whether it is a call or a put option (a C or a P).
Column 2 – Bid (pts): The “bid” price is the latest price offered by a market maker to buy a particular option. What this means is that if you enter a “market order” to sell the March 2010, 125 call, you would sell it at the bid price of $3.40.
Column 3 – Ask (pts): The “ask” price is the latest price offered by a market maker to sell a particular option. What this means is that if you enter a “market order” to buy the March 2010, 125 call, you would buy it at the ask price of $3.50.
State Farm Bank NOTE: Buying at the bid and selling at the ask is how market makers make their living. It is imperative for an option trader to consider the difference between the bid and ask price when considering any option trade. The more active the option, typically the tighter the bid/ask spread. A wide spread can be problematic for any trader, especially a short-term trader. If the bid is $3.40 and the ask is $3.50, the implication is that if you bought the option one moment (at $3.50 ask) and turned around and sold it an instant later (at $3.40 bid), even though the price of the option did not change, you would lose -2.85% on the trade ((3.40-3.50)/3.50).
Column 4 – Extrinsic Bid/Ask (pts): This column displays the amount of time premium built into the price of each option (in this example there are two prices, one based on the bid price and the other on the ask price). This is important to note because all options lose all of their time premium by the time of option expiration. So this value reflects the entire amount of time premium presently built into the price of the option.
Column 5 – Implied Volatility (IV) Bid/Ask (%): This value is calculated by an option pricing model such as the Black-Scholes model, and represents the level of expected future volatility based on the current price of the option and other known option pricing variables (including the amount of time until expiration, the difference between the strike price and the actual stock price and a risk-free interest rate). The higher the IV Bid/Ask (%)the more time premium is built into the price of the option and vice versa. If you have access to the historical range of IV values for the security in question you can determine if the current level of extrinsic value is presently on the high end (good for writing options) or low end (good for buying options).
Column 6 – Delta Bid/Ask (%): Delta is a Greek value derived from an option pricing model and which represents the “stock equivalent position” for an option. The delta for a call option can range from 0 to 100 (and for a put option from 0 to -100). The present reward/risk characteristics associated with holding a call option with a delta of 50 is essentially the same as holding 50 shares of stock. If the stock goes up one full point, the option will gain roughly one half a point. The further an option is in-the-money, the more the position acts like a stock position. In other words, as delta approaches 100 the option trades more and more like the underlying stock i.e., an option with a delta of 100 would gain or lose one full point for each one dollar gain or loss in the underlying stock price. (For more check out Using the Greeks to Understand Options.)
Column 7 – Gamma Bid/Ask (%): Gamma is another Greek value derived from an option pricing model. Gamma tells you how many deltas the option will gain or lose if the underlying stock rises by one full point. So for example, if we bought the March 2010 125 call at $3.50, we would have a delta of 58.20. In other words, if IBM stock rises by a dollar this option should gain roughly $0.5820 in value. In addition, if the stock rises in price today by one full point this option will gain 5.65 deltas (the current gamma value) and would then have a delta of 63.85. From there another one point gain in the price of the stock would result in a price gain for the option of roughly $0.6385.
Column 8 – Vega Bid/Ask (pts/% IV): Vega is a Greek value that indicates the amount by which the price of the option would be expected to rise or fall based solely on a one point increase in implied volatility. So looking once again at the March 2010 125 call, if implied volatility rose one point – from 19.04% to 20.04%, the price of this option would gain $0.141. This indicates why it is preferable to buy options when implied volatility is low (you pay relatively less time premium and a subsequent rise in IV will inflate the price of the option) and to write options when implied volatility is high (as more premium is available and a subsequent decline in IV will deflate the price of the option).
Column 9 – Theta Bid/Ask (pts/day): As was noted in the extrinsic value column, all options lose all time premium by expiration. In addition, “time decay” as it is known, accelerates as expiration draws closer. Theta is the Greek value that indicates how much value an option will lose with the passage of one day’s time. At present, the March 2010 125 Call will lose $0.0431 of value due solely to the passage of one day’s time, even if the option and all other Greek values are otherwise unchanged.
Column 10 – Volume: This simply tells you how many contracts of a particular option were traded during the latest session. Typically – though not always – options with large volume will have relatively tighter bid/ask spreads as the competition to buy and sell these options is great.
Column 11 – Open Interest: This value indicates the total number of contracts of a particular option that have been opened but have not yet been offset.
Column 12 – Strike: The “strike price” for the option in question. This is the price that the buyer of that option can purchase the underlying security at if he chooses to exercise his option. It is also the price at which the writer of the option must sell the underlying security if the option is exercised against him.
A table for the respective put options would similar, with two primary differences:
Call options are more expensive the lower the strike price, put options are more expensive the higher the strike price. With calls, the lower strike prices have the highest option prices, with option prices declining at each higher strike level. This is because each successive strike price is either less in-the-money or more out-of-the-money, thus each contains less “intrinsic value” than the option at the next lower strike price.
With puts, it is just the opposite. As the strike prices go higher, put options become either less-out-of-the-money or more in-the-money and thus accrete more intrinsic value. Thus with puts the option prices are greater as the strike prices rise.
For call options, the delta values are positive and are higher at lower strike price. For put options, the delta values are negative and are higher at higher strike price. The negative values for put options derive from the fact that they represent a stock equivalent position. Buying a put option is similar to entering a short position in a stock, hence the negative delta value. Option trading and the sophistication level of the average option trader have come a long way since option trading began decades ago. Today’s option quote screen reflects these advances.