The relative strength index (RSI) is a technical analysis tool that can be categorized as a momentum oscillator. The index tells you how quickly things have changed over a specific period. There are several ways you can use the RSI to help you enter or exit a trade. The RSI will show you when momentum is accelerating as well as when it is overdone. It can also identify periods when prices and momentum are diverging.
What is the RSI
The relative strength index was developed by J. Welles Wilder as a way of defining the rate of change. The RSI is calculated and then turned into an oscillator that fluctuates between zero and 100. The default parameter for the RSI evaluates the last 14-days but this can be altered to either increase or decrease sensitivity.
How to Use the RSI
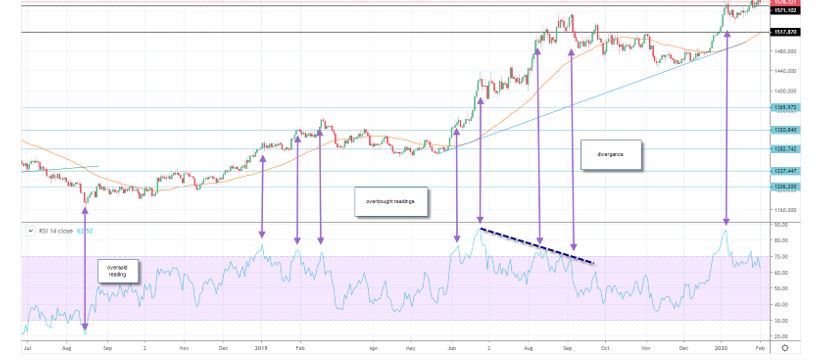
The RSI in the chart of gold describes momentum and oscillates in a range that fluctuates between 1-100. When the RSI is trending higher, positive momentum is accelerating. The reverse is true when the RSI is falling and trending lower. The beauty of the RSI is that you can evaluate the movement in the price of an asset in conjunction with momentum when you chart it on a trading platform.
When prices are rising and the RSI is also rising, you should expect the trend to continue and accelerate. When prices are declining and the RSI is also declining, you should expect the downtrend to continue. A divergence occurs when the RSI is moving at one direction and prices are moving in another. Divergence is a yellow warning sign and tells you that the trend could be weakening. Another way a divergence can be measured is through trend lines.
During this period the price of gold was rising but in September, the RSI failed to rise to fresh highs in conjunction with prices. This downward trend, measured by the dashed trend line, shows that the trend in momentum (the RSI) is sliding. This tells you that although prices are rising, and the momentum behind the rally is losing steam.
Overbought and Oversold Readings
Another way to use the RSI is to look for periods when the RSI has reached an extreme level. Reading on the RSI above 70 is considered overbought while levels below 30 are considered oversold. The RSI can remain overbought or oversold for an extended period. When a market is trending, the RSI can continue to trend. A reading above 70 is providing a warning signal alerting you to be cautious. The same can be said when you experience a reading below 30.
Takeaway
The relative strength index is a momentum oscillator that describes the rate of change of prices. To calculate the RSI, you measure the change over a lookback period which has a default of 14-days. This default can be changed, and you can use different periods including, daily, weekly, monthly and intra-day data.
There are several ways to use the RSI as a tool that can help you trade the capital markets. The RSI is often used as an indicator that measures overbought and oversold readings. The RSI can remain overbought or oversold for an extended period when a trend is in place. In addition, the RSI is used as a momentum indicator that tells you if momentum is rising or falling. The RSI is also excellent in helping you spot periods of divergence when prices are moving one way, but momentum is moving in a different direction. The RSI is an excellent technical analysis tool to place in your trading arsenal.
 Broadening Wedges, Descending
 When To Hire A Tax Attorney (And When Not To)