When it comes to currency trading, there is a vast range of different strategies you can adopt to generate trading profits. For example, you could pursue an event-focused strategy, where you place trades just after large market-moving macroeconomic or political events. Alternatively, you could put on medium to long-term trades based on your view of countries’ economic fundamentals and how they will affect their currencies in the next 6-12 months. You could also become an expert in selected particular currency pairs and focus on your trading activities around those. On the other hand, you could also adopt a technical indicator-based strategy to trade currencies, which new research shows works particularly well in ‘hot’ markets. This is the strategy we will discuss in the article.
Popular technical indicators
There are a substantial amount of technical indicators focusing on different areas, such as volume, momentum, volatility, and trend following. However, it is important to note that using just one single indicator will not help you generate a trading profit. If you want to trade forex using chart analysis and technical indicators you must always combine complimenting indicators to generate trading signals.
 Popular technical indicators include the Moving Averages, the MACD (Moving Average Convergence Divergence), the RSI (Relative Strength Index), OBV (On Balance Volume), Bollinger Bands, the Chaikin Oscillator, and the William %R. The list goes on as new indicators are created as the popularity of chart analysis tools rises. In fact, Mark Priest Head of Index & Equity Market Making at ETX Capital stated that “traders are increasingly demanding more sophisticated tools to trade forex and a large part of that is developing improved chart analysis tools to accommodate this demand.”
Combine indicators to create a trading strategy
As I mentioned above, if you want to trade forex using chart analysis the key is to combine complimentary technical indicators to generate strong trading signals. An example of a trading strategy that you could apply to your chosen currency pairs would be to combine the MACD (Moving Average Convergence Divergence), the RSI (Relative Strength Indicator) and Bollinger Bands.
Combining these three indicators you can gauge price movements based on moving averages, momentum, trend, and volatility. The way to turn these three indicators into a trading strategy is to trade when three out of the three indicators say buy (or sell) then you buy (or sell). This would be a strong signal. If two out of the three indicators give you a trade signal, you could also trade, but it would be a less strong trading signal. If only one or no indicator indicates you should execute a trade, you don’t trade.
Let’s look at how these indicators work in combination. We will use the EUR/USD as an example.
On the chart below we can see the Bollinger Bands overlaid on the candlestick chart for the EUR/USD and we can see the Relative Strength Index and the MACD below the price chart. The three indicators used actually show a buy signal for the EUR/USD on a medium term basis.
The Bollinger Bands, which are volatility bands placed above and below a moving average, show the price moving through the moving average from bottom to top during a low volatility phase (as indicated by the tight bands around the moving average). This would indicate a price increase. The RSI, which shows the momentum of the price movement, is close to pushing through the centerline indicating a change in trend towards a price rise.
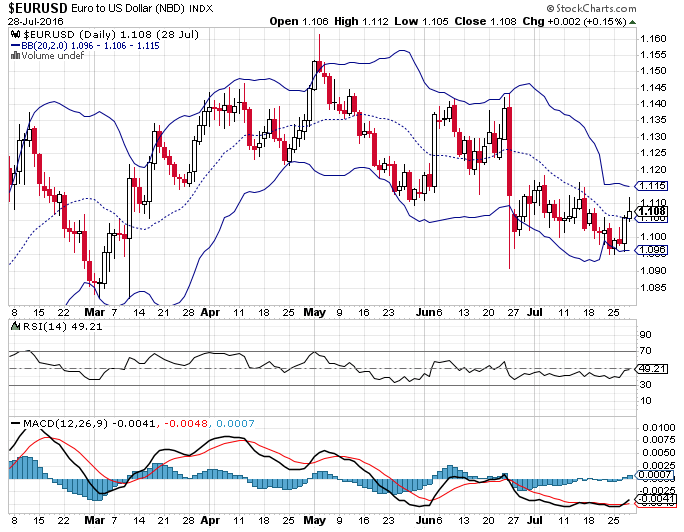
Finally, the MACD shows three, albeit weakish, buy signals. Firstly, it shows a signal line crossover of the fast moving average through the slow moving average (the black line crosses through the red line). Secondly, it shows the trend line moving towards the zero line and, thirdly, it shows the divergence between the two signal lines increasing.
Judging by the trade signals from these three indicators we should be buying EUR/USD. However, the trade signals, especially from the MACD, are not as strong as they could be so it would now depend on your risk profile whether you would want to buy EUR/USD or hold off and wait for clearer trade signals from this strategy.
Furthermore, it is important to back test technical indicator-based trading strategies using historical data. That way you can check how accurate your chosen indicator combination is at determining profitable trade signals for your chosen currency pairs.
 Double Top
 New Diversification Rules – Keep Portfolios Separate!
 Fiscal policy